The world's oceans are getting hotter; in fact, May 2024 was warmer globally than any previous May in the data record. We know that warmer ocean temperatures can mean more frequent and more intense hurricanes, but that's just one impact. Marine heatwaves (MHW) — warmer than normal water temperatures over an extended period — can impact fisheries, coral reefs and even inland temperatures.
Sea Surface Temperature Anomaly (Last 30 Days) | Source: NOAA Coral Reef Watch
GCOOS is partnering with researchers at the University of South Alabama/Dauphin Island Sea Lab (DISL) on a project focused on MHW. In addition to developing a framework for expected heatwave impacts and a heatwave alert system, the project will define the tools needed for better detection of marine heatwaves — both at the surface and in the water column — to help Gulf of America stakeholders and resource managers mitigate impacts on coastal communities, ecosystems and industries.
Former GCOOS National Academy of Sciences Policy Fellow Dr. Ren Kamakura kicked off the project that is now being led by GCOOS Research Computing Specialist Xiao Qi.
This project is under active development. If you encounter technical issues or have recommendations for improvements, please contact Xiao Qi at xiao.qi@gcoos.org.
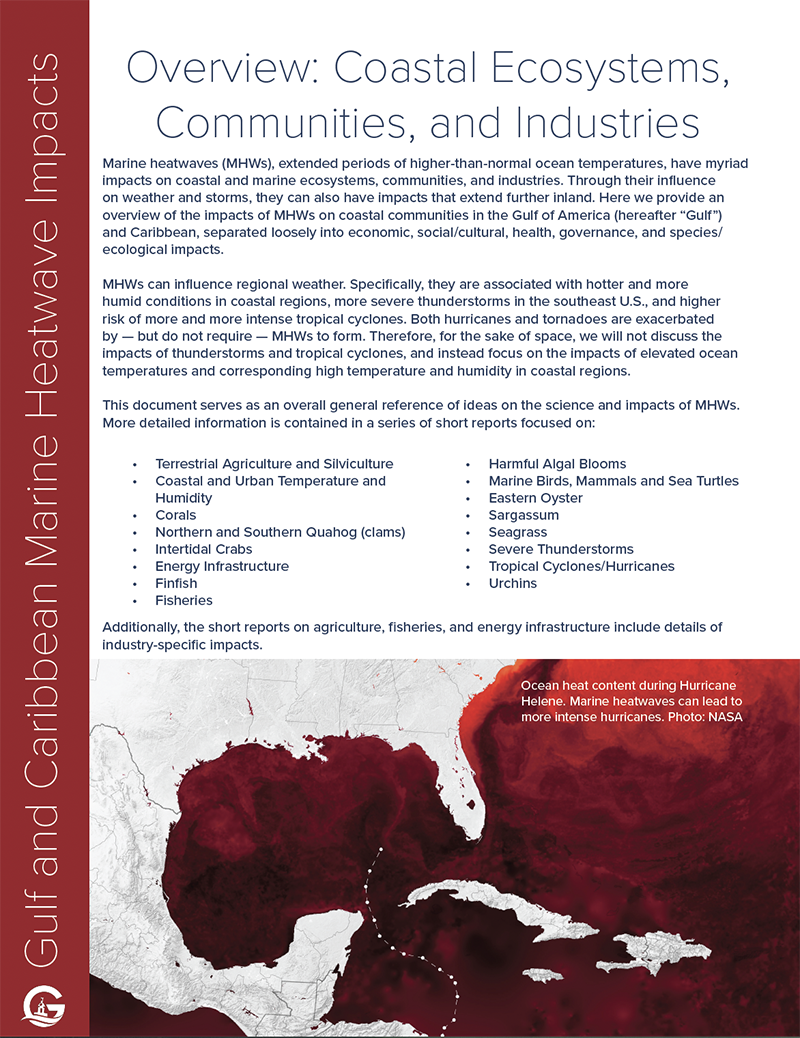
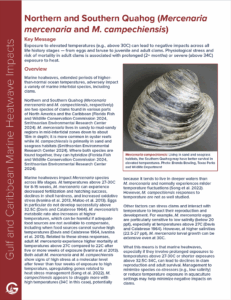
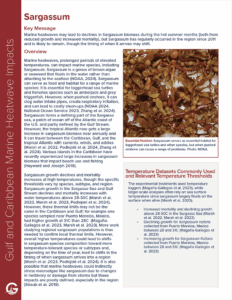
Marine heatwaves — extended periods of higher-than-normal ocean temperatures — have myriad impacts on coastal and marine ecosystems, communities and industries. As part of our ongoing marine heatwaves project, we developed "Gulf and Caribbean Marine Heatwave Impacts" discussing various heatwave economic, social/cultural, health, governance and species/ecological impacts in the region. The document includes a broad overview and a series of short reports.
Analyze marine heatwave data from Gulf of America monitoring stations using our interactive analysis tools. This platform provides access to temperature data from NDBC buoys and coastal monitoring stations, enabling visualization of marine heatwave patterns and trends across the region.
Click on any buoy station on the map below or select from the dropdown menu to explore marine heatwave events at different intensity thresholds (90th, 95th, and 99th percentiles) with daily and monthly analysis, statistical ranking, and both raw and detrended data visualizations.
Click on the buoy station in the map to calculate MHW, or
 How to calculate
High-resolution daily temperature analysis showing marine heatwave events and temperature thresholds
How to calculate
Long-term monthly climate analysis, anomaly detection, and statistical ranking of marine heatwave events
Explore daily sea surface temperature and marine heatwave patterns across the Gulf of America using high-resolution satellite data. This interactive map shows the spatial distribution of marine heatwaves from 2002 to present.
Select a date to view the daily SST map, or click any location on the map to see the complete temperature time series and marine heatwave history for that specific location.
Data source and how to calculate
Click on the map to view SST time series with climatology and marine heatwave thresholds for the selected location
GCOOS Summer Webinar Series on Marine Heatwaves and their impacts.
Stay updated with the latest marine heatwave research, monitoring efforts, and impact assessments in the Gulf of America region.